
The word Ogden hit the headlines again this week, but with details of any rate change unknown, our focus remains on the continued fallout from the past year – on this occasion, the van market.
Often eclipsed by the scale of its smaller but far more numerous cousin, van is subject to the same influences as the motor market, and in fact was hit twice as hard by rate inflation in 2017 – rising over 20% in the 12 months ending January, our latest index showed. Since October, however, the market has moved into a period of steady deflation.
Against this backdrop, there has been significant movement between brands. As with our recent post focusing on motor, we look here at pricing competitiveness to assess change, using the number one ranking on the major price comparison websites as our indicator.
From February 2017 to 2018, the larger players increased their dominance. The top 10 brands now account for 66% of total rank one quotes, up from 61% a year ago. That growth is largely driven by aggressive pricing on the part of Admiral. The Cardiff-based insurance giant now accounts for a whopping 21.3% of the most competitive van quotes – almost triple its 2017 mark of 7.3%, and more than three times its nearest rival, Flux Direct. Admiral also owns Gladiator, which accounts for 5.2% of rank ones, increasing the group’s overall competitive share to over 26%.
Rank One Positions on PCWs - Whole of Market
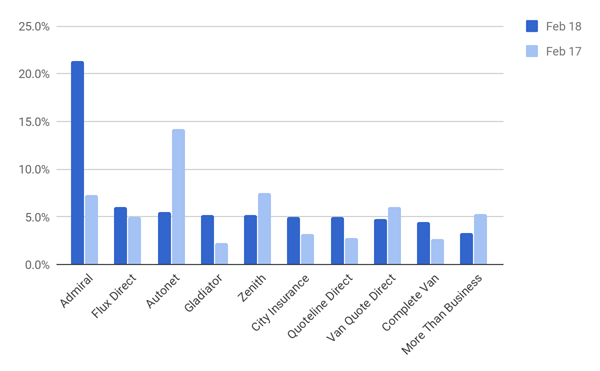
At the other end of the spectrum, Autonet has seen its competitive market share fall from 14.2% to 5.5%, and now ranks third overall. The rest of the top 10 have moved between 1% and 3% year on year, and 1.5% on average, suggesting high levels of pricing sensitivity over time.
Putting Admiral to one side, the list is more congested than in 2017, with just 2.7% separating positions 2 and 10 in 2018, down from 4.3% in 2017.
We observe distinct patterns between the top three players in the space, as the chart below shows.
Pricing movement - Top 3 brands*
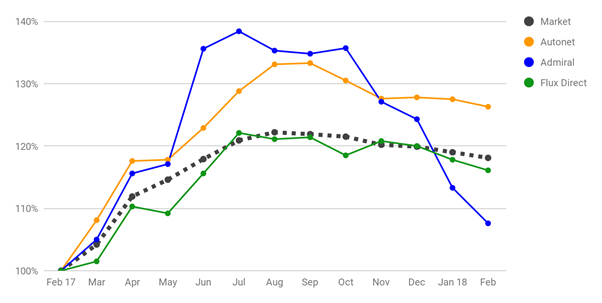
*Price comparison website data only
Two players applied pricing strategies that closely mimicked the overall market trend – a result of their being intermediated brands using large panels – while a third, with more direct control over its pricing, also broadly followed the competition, but with increasingly exaggerated movement.
A growth of 1% in overall competitiveness was enough to see Flux Direct jump four places to rank second overall in February. Admiral, having priced more expensively than Autonet for five successive months, began cutting rate aggressively in November, and fell below indexed market inflation in January. Autonet remained consistently in line with market movements, but at an average of 7.4% (and no more than 11%) more expensive than the competition. A closer look at the data reveals another reason for the brand’s overall deterioration in terms of competitive pricing position.
All change in SDP
Breaking out the market into its SDP (social, domestic, pleasure and commuting) and carriage of own goods segments, Admiral remains equally dominant, achieving 23.1% and 20.9% competitive share, respectively. For owned goods, it maintains an advantage of over 15% versus second-placed Autonet (6.4%), but in SDP there is less daylight with Flux Direct accounting for 13.7% of rank one placements. Still, this represents an overall difference of 6.4%.
In February 2017, eight brands achieved at least 5% share of the most competitive SDP quotes; in 2018, this dropped to just five. Two brands, NOVA and Principal have at least trebled their competitiveness in the past year to break into the top 10. SDP accounts for around a fifth of the total market.
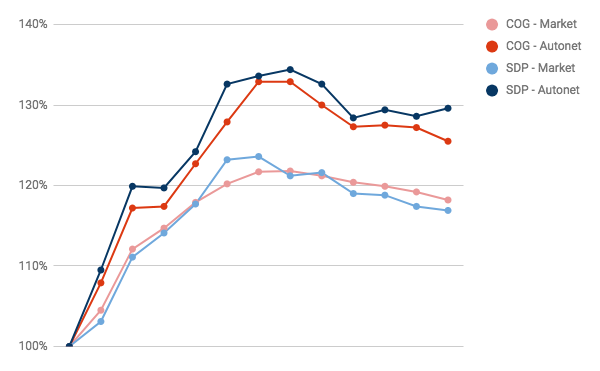
Four brands, including last February’s top two – Autonet and Right Choice – which together accounted for over a third of the most competitive quotes, have dropped out of the top 10 entirely, suggesting a huge level of pricing volatility in the segment. Autonet's pricing versus the market was on average 7.1% higher for carriage of own goods, but 9.6% higher for SDP, and was greater than 10% in five of the past six months.
Autonet Pricing vs. the Market by segment
With high levels of pricing variation between the two segments, and an overall market characterised by a wide range of pricing strategies as direct brands attempt to build market share by aggressively adjusting rate, the next few months will be particularly interesting – especially if the Government springs another surprise.

Post a comment . . .
Submit a comment