insurance market benchmarking
Trading View.
Tactical insights into market, competitor and segment dynamics, designed to drive confident trading decisions.
Welcome to Trading View - your weekly market compass.
Introducing Trading View, crafted for decision-makers in the insurance market who are pressed for time but require precise, actionable insights.
This weekly benchmarking tool distills complex market data into clear actionable insights, enabling strategic decisions on pricing and market presence swiftly and effectively.
Why Trading View?
Trading View is more than just a report; it’s a strategic tool tailored for the General Insurance industry, providing a balanced mix of depth and breadth to empower your weekly trading decisions.
Each week, you’ll receive a dynamic report filled with actionable insights that highlight critical risks and opportunities, allowing you to adjust your pricing and positioning proactively.
Markets:
![]()
![]()

Features and benefits:
- Actionable insights: Dive into data that matters. We prioritise information that impacts your operations, helping you make robust decisions swiftly.
- Strategic edge: Focused analyses on market competitors and segment dynamics, perfect for enhancing weekly trading conversations with external influences.
- Customised recommendations: Access actionable insights on price adjustments and footprint changes, directly influencing your competitive stance.
- Time efficient: Perfect for time-poor decision-makers who want to avoid analysis paralysis, but keep their finger on the pulse with market movements.
- Interactive dashboards: Engage with intuitive Power BI dashboards that make data exploration straightforward and impactful.

Enhanced decision-making

Actionable recommendations

Interactive dashboards

Automated reports
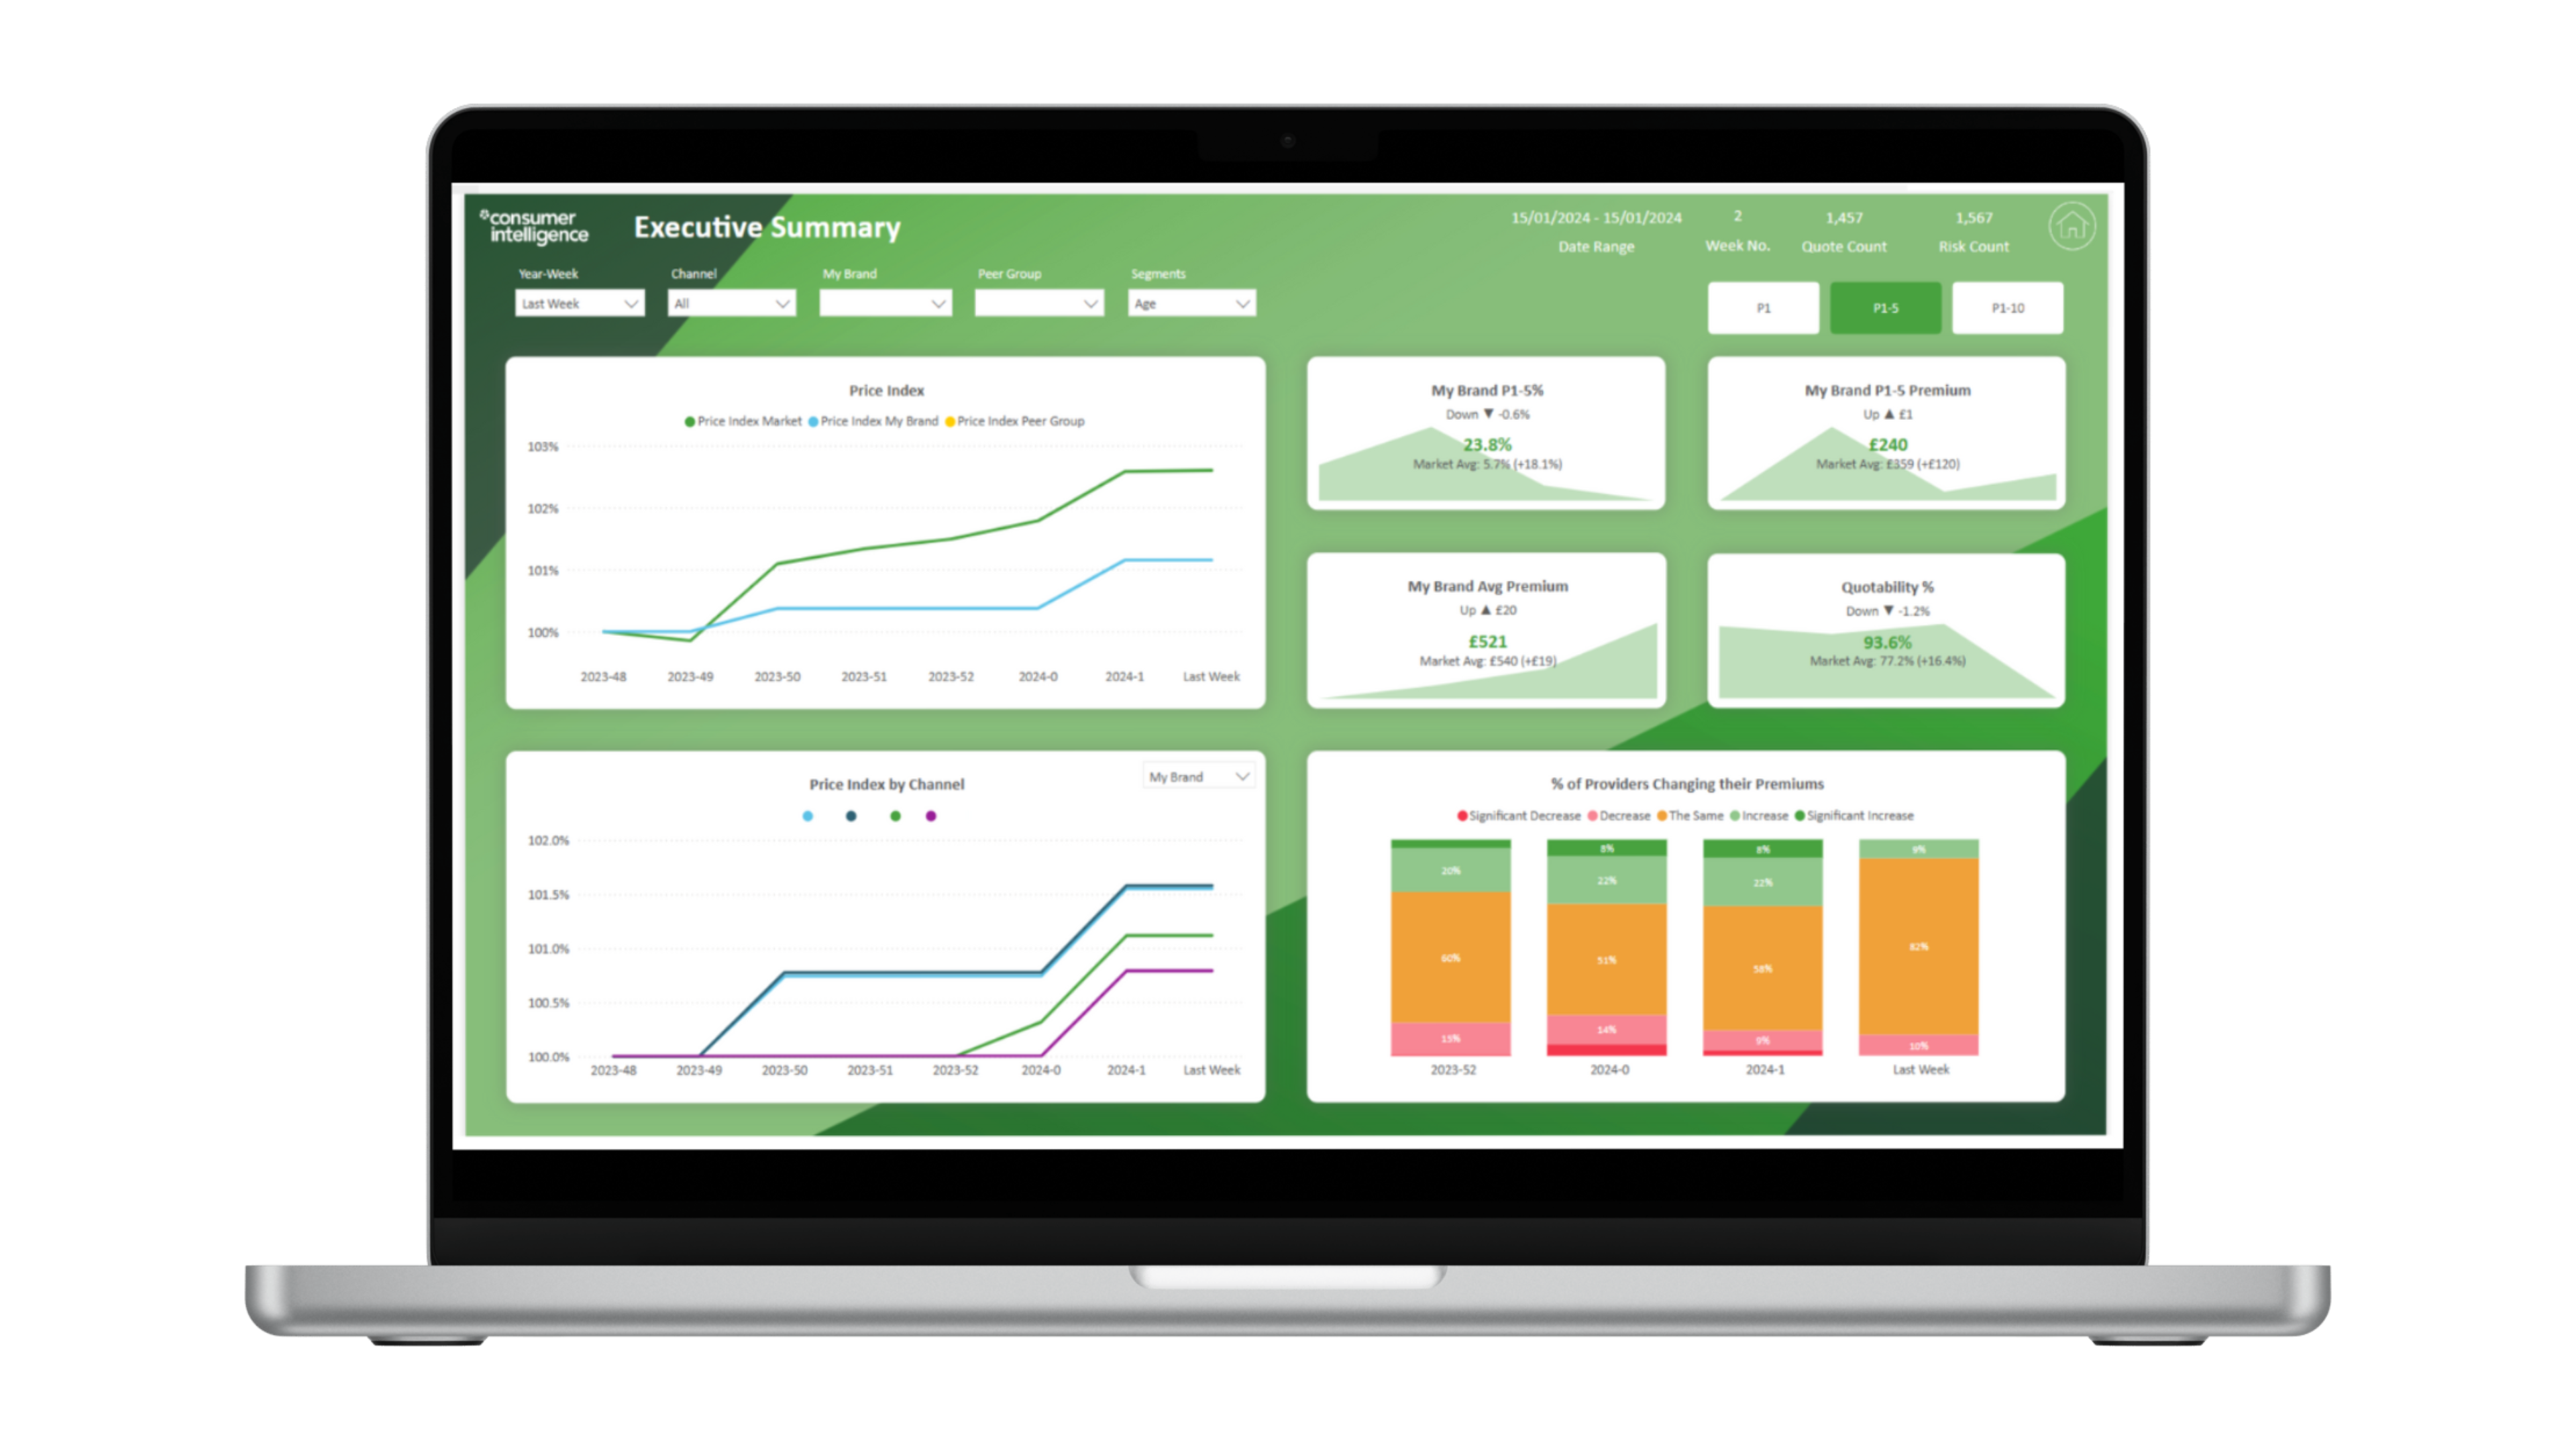
dashboard preview
Access your data via our easy-to-use online portal.
Weekly data and dynamic reports with automated insight, to help make informed trading choices.
Comprehensive, intuitive dashboards
Risks run weekly
Prices collected from 4 PCWs
Analysis areas, including footprint, price changes, positioning and price indices
Frequently asked questions.
Trading View is a weekly price benchmarking tool designed by Consumer Intelligence to provide insurance market traders and decision-makers with actionable insights. The service focuses on facilitating strategic and tactical decisions by analysing market competitors and segment dynamics alongside own brand performance. It emphasises clear, actionable information on price and footprint adjustments, helping clients stay competitive and informed on a weekly basis.
Trading View strikes a balance between our daily and monthly price benchmarking solutions. It provides an insights delivery cadence that supports responsive and strategic decision making, whilst avoiding analysis paralysis. It is designed to serve up actionable insights, without requiring users to go digging in the data. This makes it a perfect solution for time-poor decision makers working in trading or pricing related roles.
In contrast, our Daily Price Benchmarking service is best suited for clients needing near-time data for rapid decision-making, offering daily updates and granular insights, and Market View offers comprehensive monthly reports that help in understanding broader, long-term trends, suitable for strategic planning over longer periods.
Trading View focuses on the Motor and Home sectors, providing targeted insights that are relevant to these areas of the general insurance market.
Methodology summary:
- 3,024 Motor & 2,772 Home risks using Daily Price Benchmarking data rolled-up to form a single weekly data set allowing week on week comparison in PowerBI.
- Weekly data set based on Monday to Sunday with data made available to clients overnight Sunday.
We offer 12-monthly subscriptions.
Insights from Trading View are delivered through an automated weekly report every Monday morning. Additionally, clients have access to dynamic and intuitive Power BI dashboards that allow for interactive engagement with the data, enabling detailed analysis and easier interpretation of market trends and changes.
We provide comprehensive support to all our clients, including detailed onboarding, regular training sessions, and dedicated account management to help you understand and maximise the use of your data.
Other solutions that might interest you.

GIPP Performance Tracker
Track the response of the insurance market and your competitors in response to the general insurance pricing practices (GIPP) policy implementation.

Offers and Incentives Benchmarking
Optimise your product marketing and pricing strategies in a fast-paced market by accessing a uniquely comprehensive view of competitor incentives.

Insurance Marketing Substantiations
Drive growth and credibility through trustworthy marketing substantiations.