 A year ago, the Government sent shockwaves through the motor market after changing the calculations for payouts for personal injury claims.
Share prices temporarily crashed and premiums increased at unprecedented levels, before moving into reverse after the Government decided to review its decision in September.
Our data shows that notions of a consistent market response, both in the immediate aftermath and ever since, are misguided.
We trace movements in motor quotes at the market and brand level, and have observed distinct patterns of behaviour in the wake of the Ogden overhaul. While some priced conservatively for margin or aggressively for volume, holding rate rises in check while the wider market increased theirs, others appeared to play a game of cat and mouse, tracking shifts and responding in order to maintain their competitive positioning. Overall in 2017, motor premiums rose 9.7% overall, but fell 1.7% in the fourth quarter.
Our pricing analyst Michael Miskelly explains that against this backdrop of rise and fall, there is a patchwork of variation, including comparing direct to aggregated, and large to small brands. Overall, in only three months in the past year — March, April and June — did more than 75% of brands on price comparison websites act in the same way (in this case increasing rate). Direct brands were even less consistent.
The past year, in fact, has seen extraordinary levels of pricing volatility.
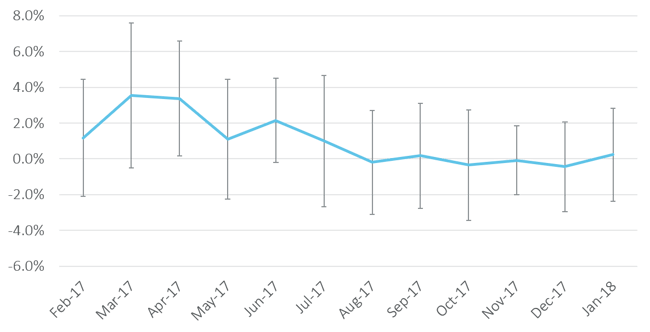
“Looking at the whole market, comprising both direct and aggregated brands, we saw average rate fluctuations of as much as +3.5% in March, the month after the revision of the Ogden rate, to -0.4% in December, the month after the Government announced it would hold Insurance Premium Tax at its current level,” Miskelly says.
The second largest average reduction was in October (-0.3%), following the Government’s Ogden U-Turn. The chart below plots this variance on a line, together with the individual extremes plotted as bars.
Average rate change — Whole of market

Price comparison website data compiled from Compare The Market
“While the average rate change tells a story of sudden shock followed by gentler ripples, it is flattened out in part by negative movements cancelling out the positive. A closer look at the data reveals much wider volatility,” Miskelly adds.
The standard deviation (SD), which captures the difference between each brand versus the average rate change, highlights just how extreme the month to month adjustments were. It belies the suggestion that the market was either entirely reactionary to Government market intervention, or has since reverted to historic norms.
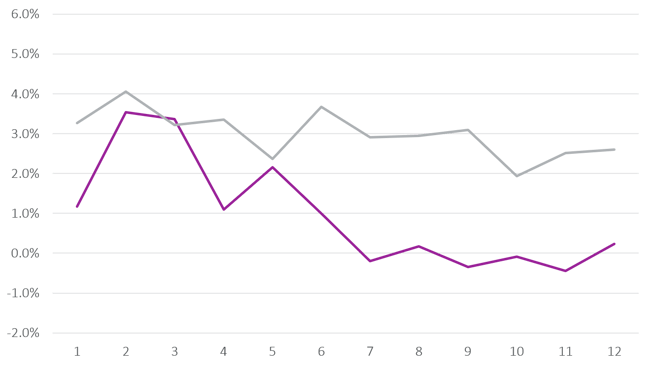
In the twelve months ending January, we see an average deviation of 3%, which means that on average, every brand differed from the rest of market by this figure. For example in September, the overall market rate fluctuated by just + 0.2%. However, on average, brands differed from this amount by 2.9%.
It’s hardly a picture of consistency. The largest overall SD was, unsurprisingly, in March at 4.1%. Yet in 6 of the past 12 months, we saw SD of at least 3%, and only in one (November) did it drop below 2%.
The chart below illustrates the difference. As the overall market rate change levels off from August, the variance between brands remains high.
Average market rate change vs. average standard deviation

Average standard deviation (grey) vs average change (purple)
Accounting for the key brands we monitor we see more consistency but still high overall levels of volatility, with the average SD standing at 2.2%. Interestingly, this group displayed higher volatility in Q4, reflected by many of them aggressively reducing rate, particularly in December.
Indeed John Blevins, our pricing manager, notes that even with the seismic shocks earlier in the year, brands have still priced according to seasonal trends.
“Historically we have seen, at a market level, rates dipping from December to February followed by an upturn from March. This could be due to insurers becoming more competitive to meet their end-of-year numbers,” he says.
“Whether driven by Ogden, IPT or renewal notices, 2017 was a perfect storm,” concludes Ian Hughes, our CEO.
“We are still seeing the impact of this within the market with brands adjusting their strategies on a microscopic basis. Some have been sold or refinanced, some have simply disappeared. Others have thrived.”
When will the motor market return to business as usual? Let us know in the comments, below.


Submit a comment