
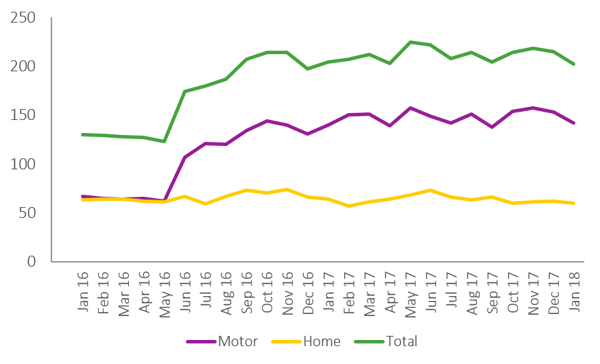
Last month we revealed that price comparison websites (PCWs) have as many as 225 combined offers, or incentives, live per month. Consumers are spoilt for choice, although we know in the purchasing decision game, price remains king.
In the first of a two part article, we’ll examine some of the differences and trends in offers, and what it means for consumers and brands playing in this space.
1. It’s a wide — and not exactly level — playing field
There is a wide variation between the type of offers, and how frequently they appear on the four dominant PCWs. In total, we have categorised 13 types of incentive including cashback, free add-ons, conditional discounts, MOT discounts, payment by instalments and vouchers. All have varying levels of appeal, and likely effectiveness, but for the sake of consistency here we treat them as equal.
In terms of the total market, motor offers more than doubled between January 2016 and 2017, but have increased just 1.5% in the past year. The home offers market has remained largely flat in the past two years.
PCW offers for motor and home
2. Scale is not a dependency for offering deals to consumers — but it helps
We see incentives from brands large, medium and small. However, some higher profile deals such as Admiral’s £30 cashback deal on MSM last month, and AXA’s 10% home insurance discount currently running illustrate the bargaining power of brands with PCWs. Such deals are likely co-funded, and bigger brands with the budgets to match can utilise co-branded advertising opportunities with PCWs, including on television. Such arrangements are compelling as they can bring in high volumes of business, offsetting any impact on margin, to the benefits of both parties as well as the consumer. We see this trend in the past year with a broad rise in the number of exclusive offers, as the PCWs attempt to differentiate their offerings.
3. Motor offers have found their level
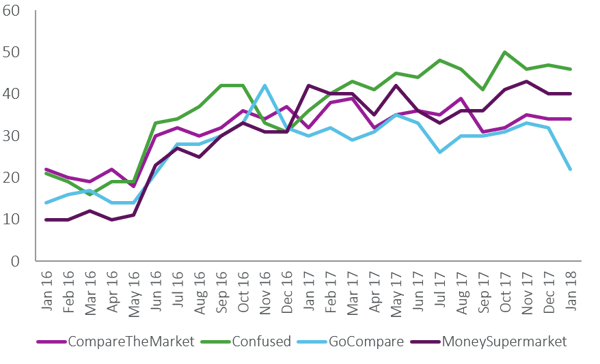
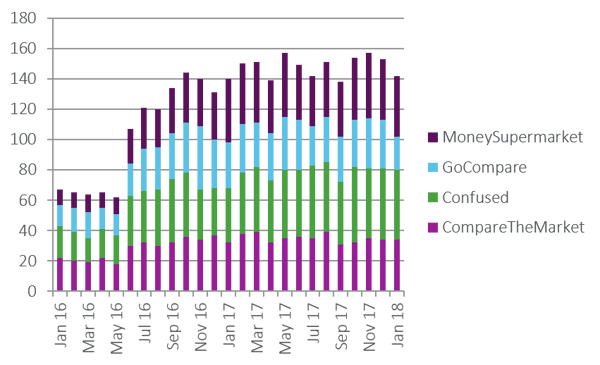
From a low of 62 in May 2016 to a high of 157 in May and November last year, overall volatility has narrowed significantly over the past year, settling at a little under 150 per month. We see emerging daylight between all PCWs, maintaining their positions, suggesting they may have adopted increasingly targeted offer-based strategies.
Motor - total offers by month
4. Home is more static — but more volatile between PCWs
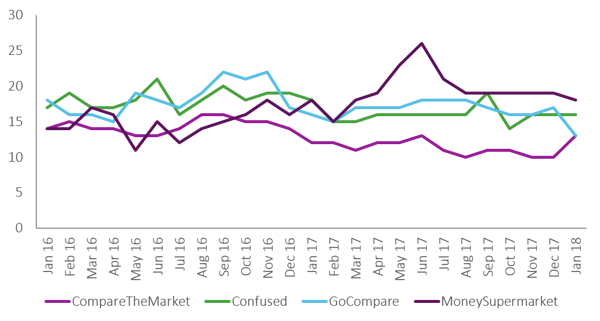
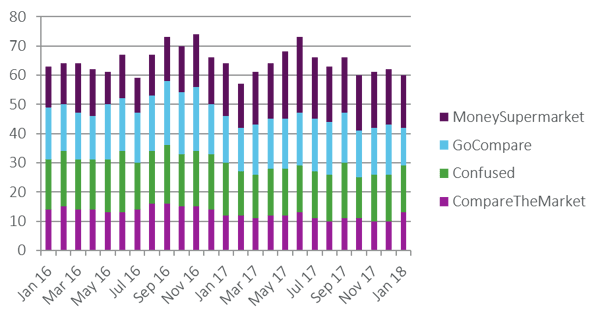
For home, we see a flatter market in terms of overall growth, but high volatility and variance between PCW brands. The total numbers are both smaller than motor and trading within a narrower range, with the floor 57 in February last year, and the ceiling 73 in September 2016 and June 2017.
Home - total offers by month
5. PCWs appear to have established their positions
We observe a level of entrenchment at both ends of the market. Overall in motor, GoCompare has had the fewest offers for every month in the past year, and shows no signs of changing its stance, dropping to its lowest mark (22) since June 2016. By contrast, Confused has had the most offers for each of the past twelve months. In home, we see Compare The Market offering the fewest deals to consumers, again over prolonged period (since September 2016), while Moneysupermarket have led on volume since January 2017.
Drilling down into offer type, we see high levels of tactical variation, in particular with exclusive deals. In the past year, for example, Moneysupermarket has offered over ten times the number of exclusive deals as Compare The Market. As ever, the key is how you cut the data, and it should be noted that offers are are, even when effectively employed, a marginal driver when it comes to purchasing behaviour and attribution.
In the concluding part of this article, we will look more closely at specific offer types, including cashback, and how incentives — and the way they are presented — impacts consumers.



Submit a comment