If you’re winning customers who want to pay annually, chances are you could be missing out on those who pay in monthly instalments – and vice versa.
The Financial Conduct Authority (FCA)’s financial lives survey suggests one third of buildings and contents insurance customers pay in monthly instalments and 36% of motor customers, rising to half of consumers with low financial resilience.
These figures are likely to rise as inflationary pressures on everyday bills make it harder for drivers to afford a lump sum payment of £832 for car insurance.
In its recent Dear CEO letter the FCA warned: “The combination of premium finance products with high APRs and typically lower associated credit risk for these types of products (as policies can be cancelled in the event of non-payment) could potentially mean some products may be in breach of our [fair value] Rules.”
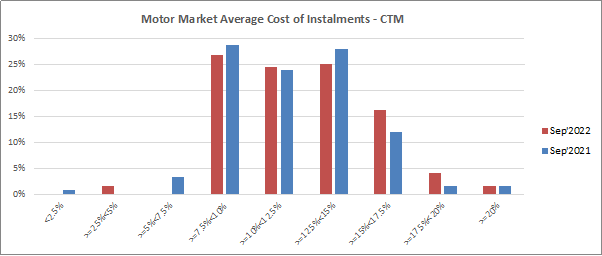
Our own figures show that the average cost of credit for car insurance – the difference between the annual premium and total instalment cost from a brand per same risk – has reduced from an average of 12.7% in September 2021 to 12.2% in September 2022, with a reduction in the proportion of brands charging over 15%.
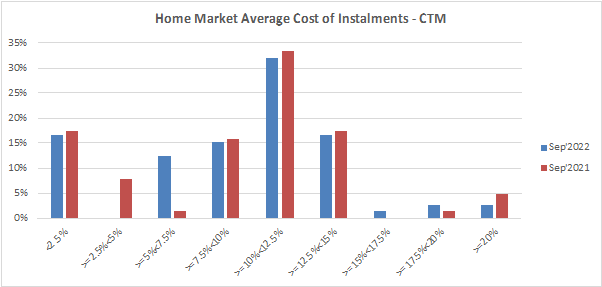
It was already lower in home insurance and has barely moved during the year, with the average cost of credit 9.6% (2021: 9.7%).


As the market responds to these new product governance rules and adapts risk selection, brands should monitor their competitive position in monthly as well as annual premiums. As our new analysis shows, these have shifted greatly.
Motor winners
Our September MarketView figures shows that the second and third most competitive brands for annual payments fall into positions 10 and 11 when it comes to monthly R5 share on one major Price Comparison Website. Conversely, the fifth most competitive brand for monthly customers drops down to 27th for annual payments.

Home winners
The home market differs in that it is dominated by aggressive pricing by newer brands and tiers across both annual and monthly customers.
The most competitive
motor brand delivered 21% of Top 5 quotes for annual and 17% for monthly customers, whereas the most competitive home brand appeared to over a two-thirds of annual customers and nearly three quarters of monthly customers. This means the five most competitive home brands were more consistent, albeit with positions 3 and 4 reversed.
It’s worth noting that this is unrecognisable from a year ago, when the most competitive brand for monthly-paying home customers delivered a top 5 quote for 23.3% of monthly customers.

Indeed this year’s cohort of competitive home brands barely featured a year ago, meaning last year’s winners could find themselves with a very different profile.
| % Rank 1-5 | Sep 22 Monthly | Sep 21 Monthly |
| Brand 1 | 73.5% | N/A |
| Brand 2 | 47.5% | N/A |
| Brand 3 | 37.1% | 8.5% |
| Brand 4 | 33.0% | N/A |
| Brand 5 | 24.7% | N/A |
Whether the newcomers will hold their pricing and permanently change the landscape remains to be seen.
Brands which count on instalment income and target one payment type over another should be alive to evolving market dynamics.
Understand and optimise your competitive position.
Our Market Benchmarking gives you a comprehensive understanding of market dynamics, competitor behaviour, and more. Helping you view your competitive position against other brands.
Comment . . .


Submit a comment