
Last month we revealed the huge range of prices for Protected No Claims Bonus (PNCB). These spanned £1.95 to £93.15 in one example of a real risk.
With such a big pricing difference for products with the same description, how can a consumer navigate and assess whether the price represents good value for money?
The term ‘protected no claims bonus’
To begin with, we wanted to find out what drivers thought the product covers. Our research reveals that many consumers themselves don’t understand what ‘protected no claims bonus’ covers.
Our Viewsbank poll of 1,181 drivers revealed that most erroneously believe no claims bonuses are protected in situations where they’re often not. E.g only 44% correctly answered that drivers would lose their no claims bonus if they were hit by an uninsured driver.
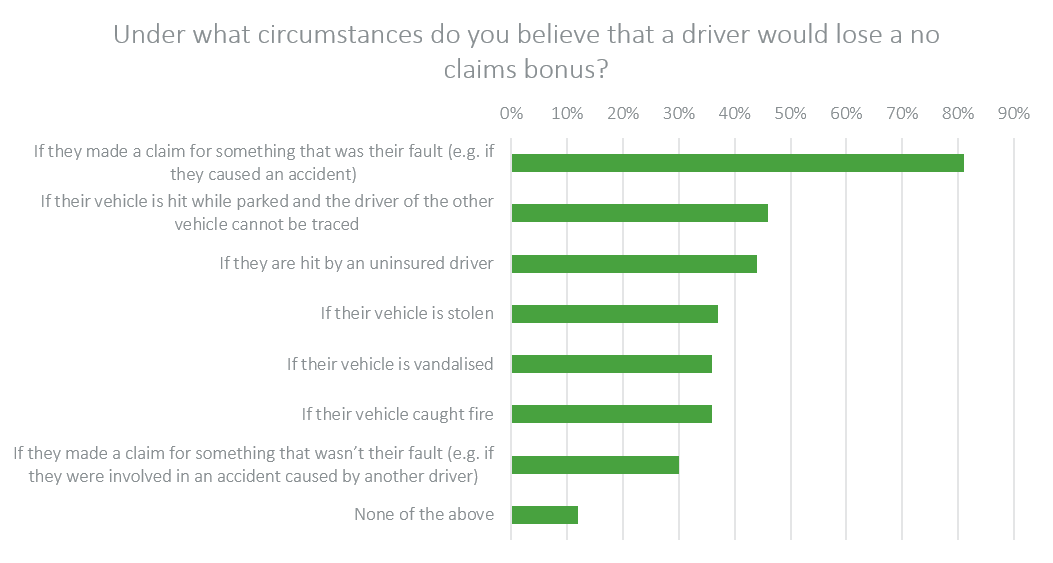
Viewsbank survey conducted 15-17 March 2019 with 1,181 motorists
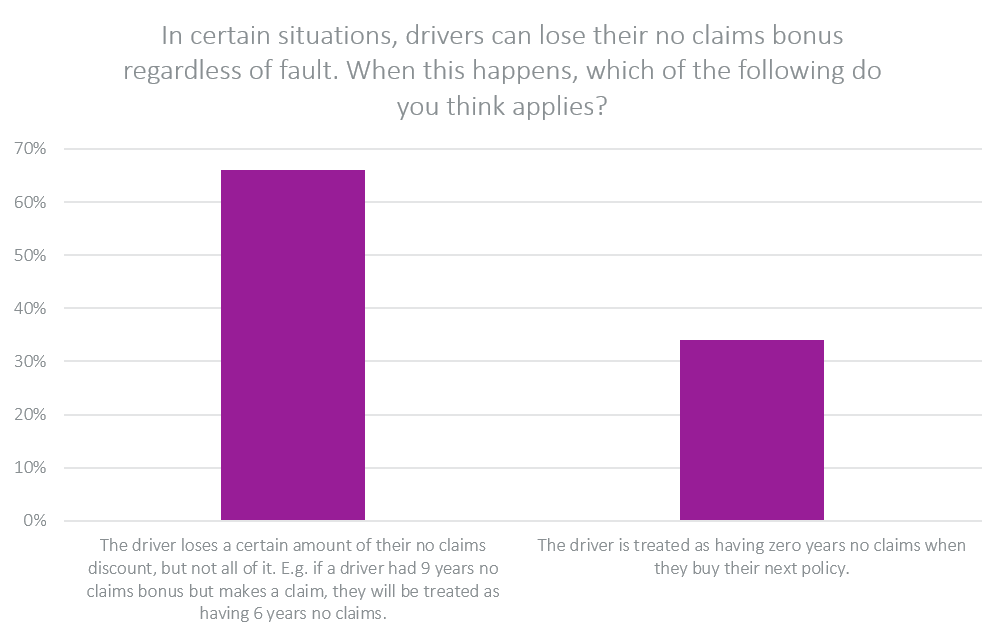
One third of drivers also potentially overestimate the benefits of protected no claims bonus, falsely believing that making a claim eradicates all PNCB, as opposed to stepping back according to a scale
Range of Maximum PNCB levels
Poor decision making in the purchase of PNCB is something that the Competition and Markets Authority (CMA) addressed three years ago with rules requiring motor insurance brands to show ‘step-back’ tables — which explain how many years no claims bonus a driver would lose if they made a claim — as well as how much bonus is offered for various years without claims.
Currently no information is given about PNCB scales and step-backs by price comparison websites, and customers see this information on individual brand’s sites during the latter part of their buying journey.
But it’s a big leap from those abstract percentages, however transparent, to the ultimate figure of how much more would a driver pay if they made a claim.
We think there’s an opportunity for those ranges and scales to be translated into pounds and pence, to simply show customers an indication of how much their premium would rise if they made a claim.
Another way
We analysed 27 brands and found that 10 offered good value for money, which we assessed as a high cost increase they were protecting, relative to the price of the protection.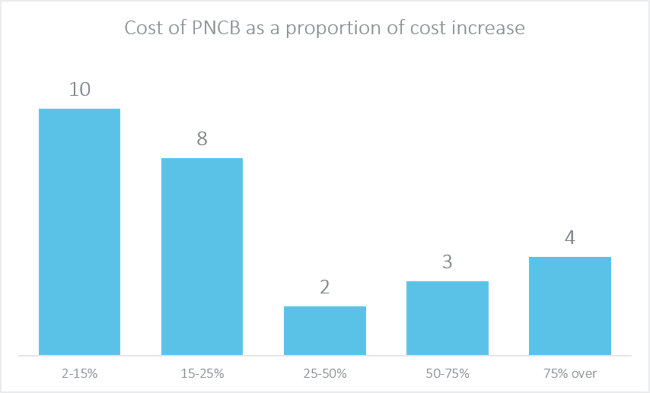
For example, one provider charged £1.95 for a driver with nine years no claims to protect their no claims bonus level. If that driver made one claim in the next year, their premium would rise by £109.12 after the step back of that particular brand was applied. I.e. the protection cost 2% of the sum it was protecting.
Others offered quite poor value for money.
In another real example, we found one brand charging £48.68 to protect nine years’ NCB, where a claim would have increased the premium cost by £74.71. I.e. the protection cost 65% of the sum it was protecting. And claims frequency data suggests there is only a c.6% chance of PNCB being used.
What explains the gap? Most motor brands offer their maximum bonus level to drivers who have driven for 9 years without making a claim. But the bonus level offered to these drivers ranges from 34% to 80%

As the CMA’s own concern demonstrated, poor consumer understanding can lead to poor decision making and evaluation of a products value for money.
A translation of step-back scales into potential premium rises, specific to the individual could help improve customer outcomes.
Insight that will enable you to optimise your pricing strategy
Download our Car Insurance Price Index to gain insight into market movements, benchmark the major van insurance brands and help you understand the data behind the results.

Comment . . .
Submit a comment